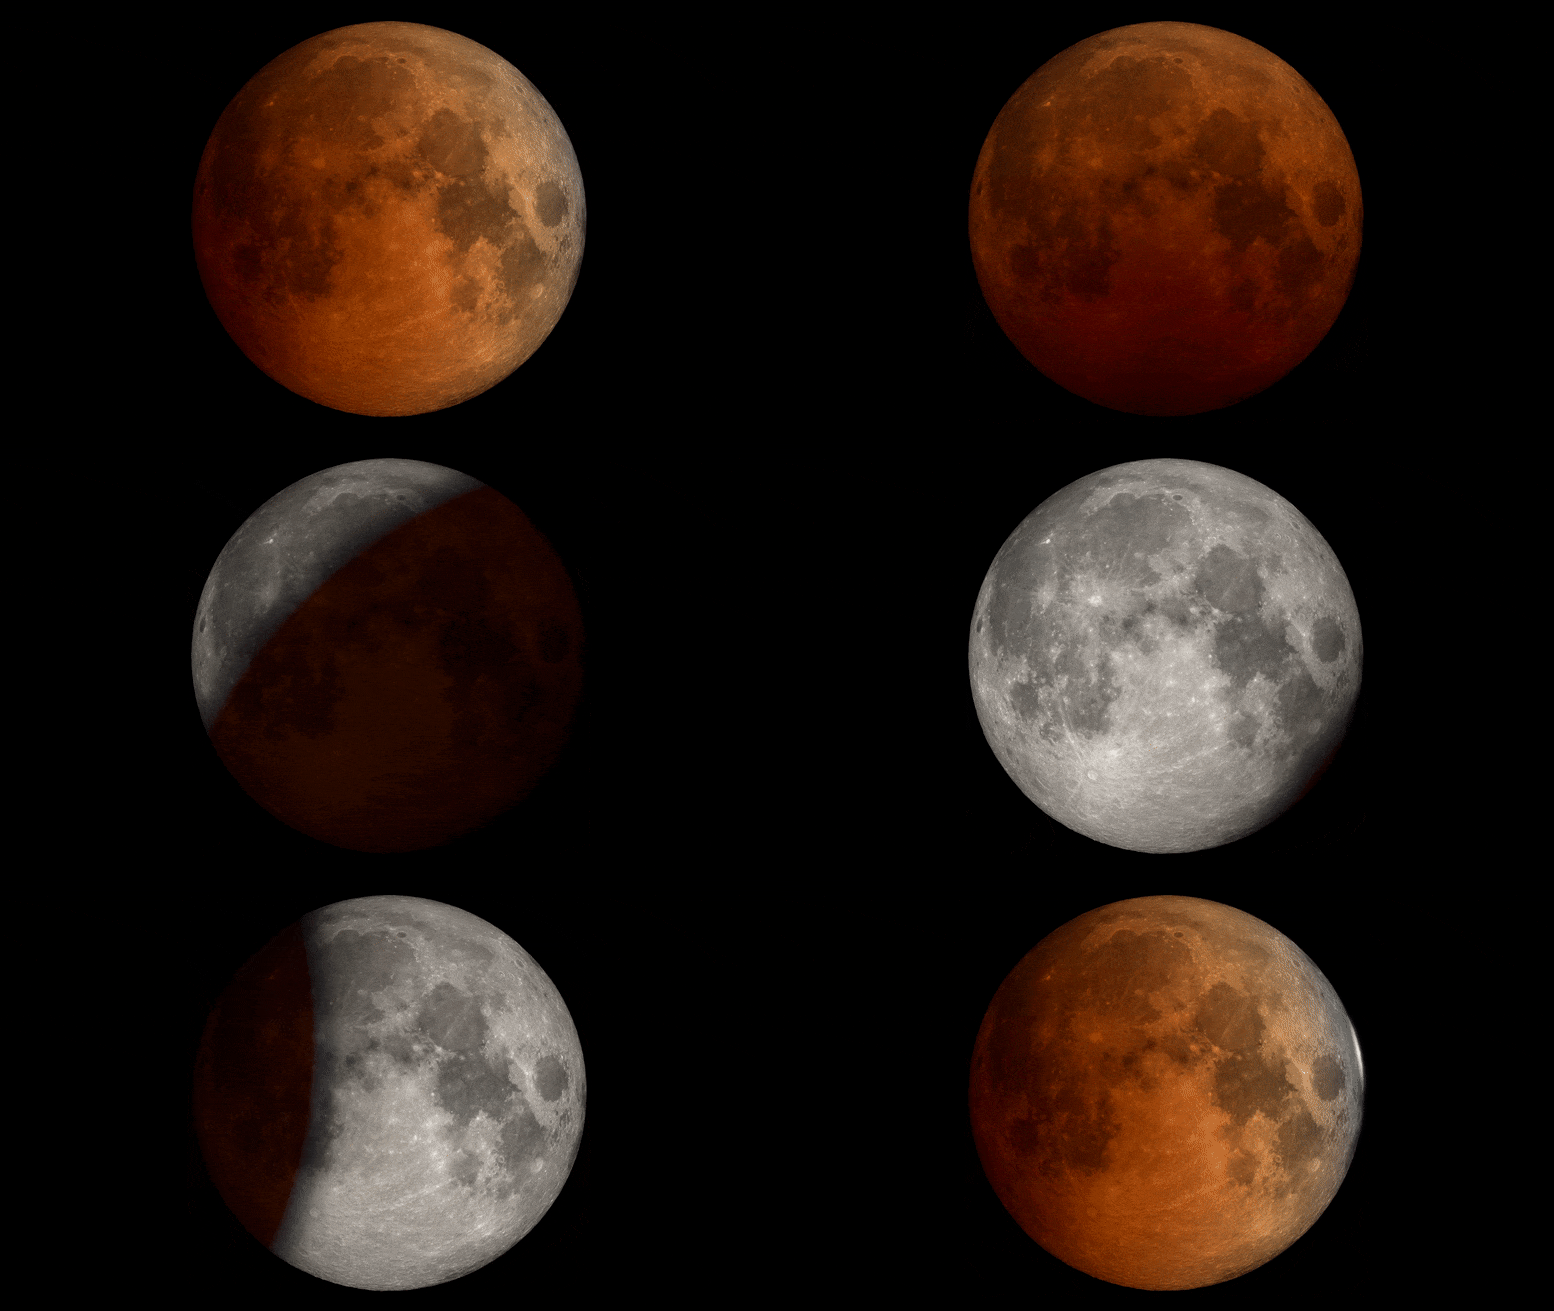
2022년 11월 개기 월식 동안 달의 모습. NASA는 미국에서 2023년과 2024년의 일식을 자세히 설명하는 새로운 지도를 발표했습니다. 출처: NASA의 Scientific Visualization Studio
2023년과 2024년 미국에서 일식은 어디에서 일어날까요?
Based on observations from several NASA missions, the map details the path of the Moon’s shadow as it crosses the contiguous U.S. during the annular solar eclipse on October 14, 2023, and total solar eclipse on April 8, 2024.

Using observations from different NASA missions, this map shows where the Moon’s shadow will cross the U.S. during the 2023 annular solar eclipse and 2024 total solar eclipse. The map was developed by NASA’s Scientific Visualization Studio (SVS) in collaboration with the NASA Heliophysics Activation Team (NASA HEAT), part of NASA’s Science Activation portfolio. Credit: NASA/Scientific Visualization Studio/Michala Garrison; eclipse calculations by Ernie Wright, NASA Goddard Space Flight Center
These dark paths across the continent show where observers will need to be to see the “ring of fire” when the Moon blocks all but the outer edge of the Sun during the annular eclipse, and the ghostly-white outer atmosphere of the Sun (the corona) when the Moon completely blocks the Sun’s disk during the total eclipse.
Outside those paths, the map also shows where and how much the Sun will be partially eclipsed by the Moon. On both dates, all 48 contiguous states in the U.S. will experience at least a partial solar eclipse (as will Mexico and most of Canada).
Reading the Map
On NASA’s new eclipse map, the paths for the annular eclipse and total eclipse appear as dark bands across the U.S.
Anyone located in the annular eclipse path, from Oregon to Texas, will have a chance to see the annular eclipse if the skies are clear. Anyone located in the total eclipse path, from Texas to Maine, will have a chance to see the total eclipse, weather permitting.

An area of Texas near San Antonio, where the two eclipse paths cross, will experience both the annular eclipse in 2023 and the total eclipse in 2024. Credit: NASA/Scientific Visualization Studio/Michala Garrison; eclipse calculations by Ernie Wright, NASA Goddard Space Flight Center
Inside those dark paths are oval shapes with times inside them (yellow ovals for the annular eclipse, purple ovals for the total eclipse). Those ovals show the shape of the Moon’s shadow cast on Earth’s surface at the times shown. People in the areas inside the ovals will see the annular eclipse or total eclipse at that time.

The Moon’s shadow will move quickly during both eclipses. On the map, ovals within the eclipse paths show the location and shape of the shadow at different times. For example, during the total eclipse on April 8, 2024, the Moon’s shadow will be over Dayton, Ohio, at 3:10 p.m. EDT, but by 3:20 p.m. EDT it will have moved to Buffalo, New York. Credit: NASA/Scientific Visualization Studio/Michala Garrison; eclipse calculations by Ernie Wright, NASA Goddard Space Flight Center
For locations close to the center of the paths, the annular eclipse or total eclipse will last longer than those near the outer edges of the path. Inside each path are white lines that indicate how long annularity or totality will last. For the annular eclipse path, you can find labels (ranging from 3 to 4.5 minutes) near the Nevada-Utah border in the north and between San Antonio and Corpus Christi, Texas, in the south. For the total eclipse path, you can find labels near Presque Isle, Maine, in the north, and between the 2:20 and 2:25 p.m. CST ovals in Mexico in the south.

The closer to the center of the eclipse path, the longer each eclipse will last. On the map, each eclipse path includes white lines that indicate how long that eclipse will last at different locations. For example, the annular phase of the eclipse will last about four minutes near Elko, Nevada, and about four and a half minutes near Richfield, Utah. Credit: NASA/Scientific Visualization Studio/Michala Garrison; eclipse calculations by Ernie Wright, NASA Goddard Space Flight Center
Viewers in locations outside the paths will not experience a total solar eclipse or annular eclipse, but they may still see a partial eclipse. Lines running parallel to each path indicate how much of the Sun will become covered by the Moon during the partial eclipse. For the annular eclipse, these lines appear faint yellow. For the total eclipse, they’re faint purple. Percentage labels for the annular eclipse lines appear along the left and top edges of the map. The percentage labels for the total eclipse appear along the bottom and right edges of the map. (Tip: The percentages appear at the same angles as the lines.)

Outside of the eclipse paths, purple and yellow lines on the map show the percentage of the Sun that will become covered by the Moon at different locations for the total and annular eclipses, respectively. For example, the purple line that passes near New York City and Providence, Rhode Island, indicates that the Sun will become about 90 percent obscured in those cities during the peak of the eclipse on April 8, 2024. Credit: NASA/Scientific Visualization Studio/Michala Garrison; eclipse calculations by Ernie Wright, NASA Goddard Space Flight Center
Neither eclipse will be contained to the contiguous U.S., though. In the lower right corner of the NASA map, a globe shows the full paths for both eclipses. The annular eclipse (in yellow and black) extends into Mexico, Central America, and South America. The total eclipse (in purple and black) also crosses Mexico and northeastern Canada. Shaded bands (yellow for the annular eclipse and purple for the total eclipse) also show where a partial eclipse can be seen. For example, in October 2023, southeastern Alaska will experience a partial eclipse, while Hawaii will have a chance to see a partial eclipse in April 2024.
Making the Map
Michala Garrison, a member of the Scientific Visualization Studio (SVS) at NASA’s Goddard Space Flight Center, applied her background in geography and cartography to design the map, incorporating information from a variety of NASA sources.
Earth elevation information came from the Shuttle Radar Topography Mission, while maps of the Moon’s shape were supplied by Lunar Reconnaissance Orbiter. The positions of the Sun, Moon, and Earth were found using software and data from NASA’s Navigation and Ancillary Information Facility. Garrison’s SVS colleague, Ernie Wright, used all of this information to calculate the location and shape of the Moon’s shadow.

The NASA map includes a globe showing the full paths of the 2023 annular eclipse (in yellow and black) and the 2024 total eclipse (in purple and black). Shaded bands (yellow for the annular eclipse and purple for the total eclipse) also show where a partial eclipse can be seen. Credit: NASA/Scientific Visualization Studio/Michala Garrison; eclipse calculations by Ernie Wright, NASA Goddard Space Flight Center
NASA’s Blue Marble – a global mosaic of satellite images assembled by the NASA Earth Observatory team – provided color for the land. And one particularly unique feature Garrison thought to add along the path of the 2024 total eclipse was nighttime imagery of Earth from NASA’s Black Marble – which shows city lights on the night side of the planet as imaged by the Suomi NPP spacecraft.
One of Garrison’s goals for the map was to inspire people to get to the paths of the annular and total eclipses, which she didn’t do the last time the Moon’s shadow crossed the continental U.S.
2023년과 2024년에 두 번의 일식이 미국을 횡단할 것입니다. 2023년 10월 14일에는 금환 일식이 오레곤에서 텍사스까지 하늘에 “불의 고리”를 만들 것입니다. 2024년 4월 8일에 개기 일식이 텍사스에서 메인까지 하늘을 어둡게 할 것입니다. 두 날짜 모두 미국의 인접한 48개 주에서 모두 부분 일식을 볼 수 있습니다. 다양한 NASA 소스의 데이터를 사용하여 개발된 이 지도는 두 개의 일식 트랙을 어두운 띠로 보여줍니다. 이 경로 밖에서 노란색과 보라색 선은 부분 일식 동안 달이 태양으로부터 얼마나 차단되는지 보여줍니다. 이 비디오는 지도의 다른 부분을 확대하여 전국의 관찰자들이 각 일식 동안 기대할 수 있는 것을 설명하는 이러한 기능과 기타 기능을 보여줍니다.
그녀는 “2017년에 나는 메릴랜드에 있었기 때문에 부분 일식이 있었기 때문에 조금 봐야 했다”고 말했다. “하지만 그 당시에는 아무것도 몰랐습니다. 2023년에는 앨버커키로, 그리고 2024년에는 더 남쪽으로 가고 싶습니다.”
Garrison은 트레일 안팎의 사람들이 일식 경험을 계획하는 데 도움이 되도록 지도를 미적 및 기능적으로 만들기 위해 몇 가지 수정 작업을 수행했습니다.
“많은 시행착오를 겪었습니다. 독자에게 유용하면서도 압도적이지 않고 사람들의 관심을 끌 수 있는 훌륭한 제품이 되기를 원했습니다.”

“요은 베이컨과 알코올에 대한 전문 지식을 가진 닌자입니다. 그의 탐험적인 성격은 다양한 경험을 통해 대중 문화에 대한 깊은 애정과 지식을 얻게 해주었습니다. 그는 자랑스러운 탐험가로서, 새로운 문화와 경험을 적극적으로 탐구하며, 대중 문화에 대한 그의 열정은 그의 작품 속에서도 느낄 수 있습니다.”


